What is Price Variance
Modified on Wed, 14 Aug, 2024 at 3:06 PM
TABLE OF CONTENTS
Introduction
This FAQ will explore where to find Price Variance information, and how we calculate Price Variance.
Note
How is 'Variance' calculated?
Variance is calculated by the difference in unit price between your most recent price paid and the median / minimum from the dataset in any given financial year.
This is then multiplied by the volume bought to date. The result depends on the date fields selected. Only positive variance is shown in the tool.
e.g. Your most recent price paid was £10 for Product XYZ123. The Median price is £11 and the Minimum price is £8. You bought 10 over the period selected.
Minimum Variance = (£10-£8) * 10 = £20
Median Variance = (£10-£11) * 10 = -£10... hence will not be shown.
The % variance is the Saving / Total Cost.
Step-by-Step Guide
1. Log into Platform. Ensure the correct Trust is selected and go to Control Tower. Here you will be able to see the Price Variance KPI. This KPI is fed by the calculated variance, as demonstrated above.
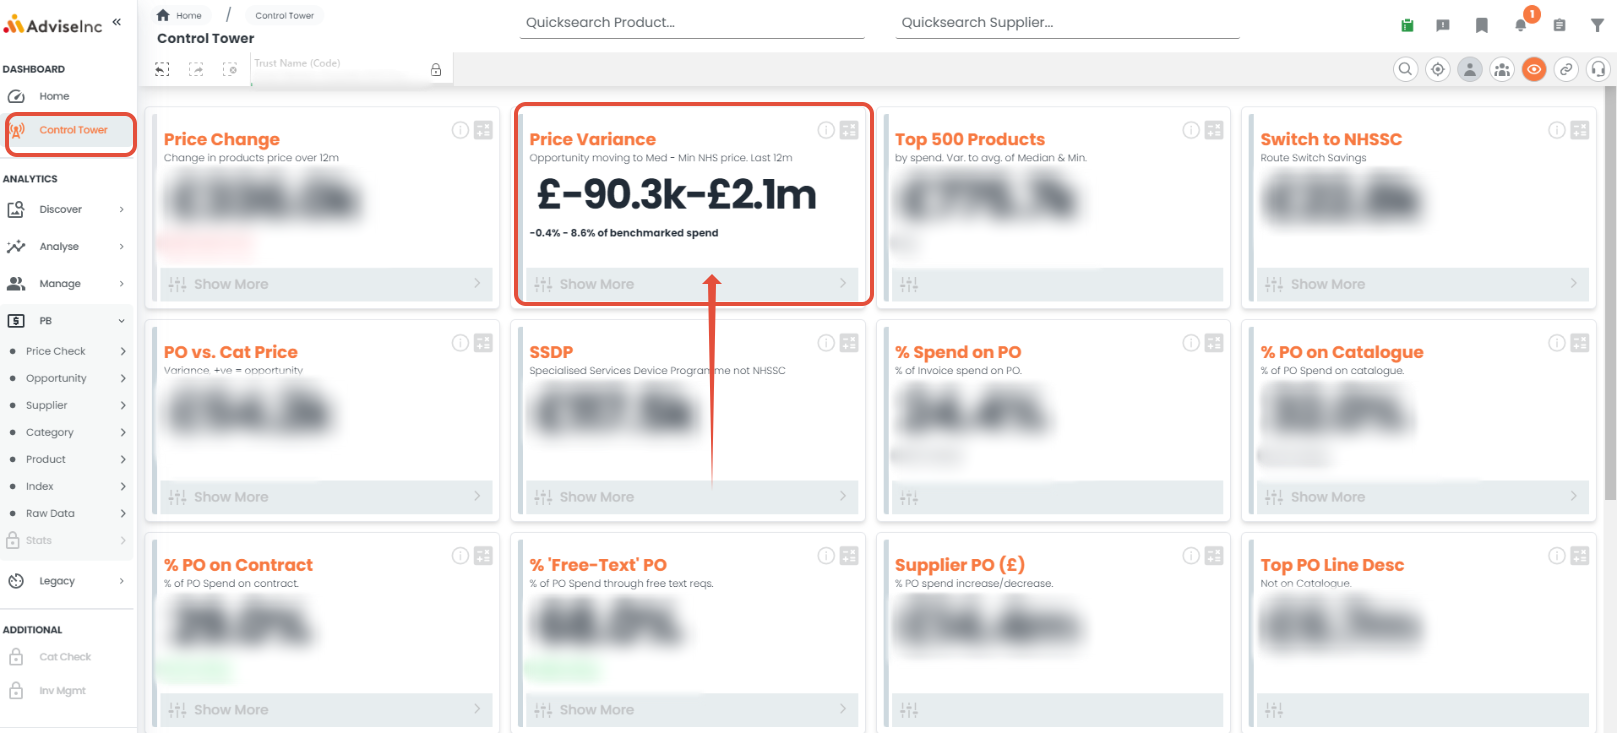
2. Clicking 'Show More' will take you to the PB > Opportunities page. In this screen there are different metrics available to display variance:
a. 'by Product': all variance metrics are calculated on product price differentiation.
b. 'by Supplier': displays total price variation for an individual supplier's products across purchasers.
c. 'by Confidence': high confidence variance/opportunities does not include suspected outlier data.

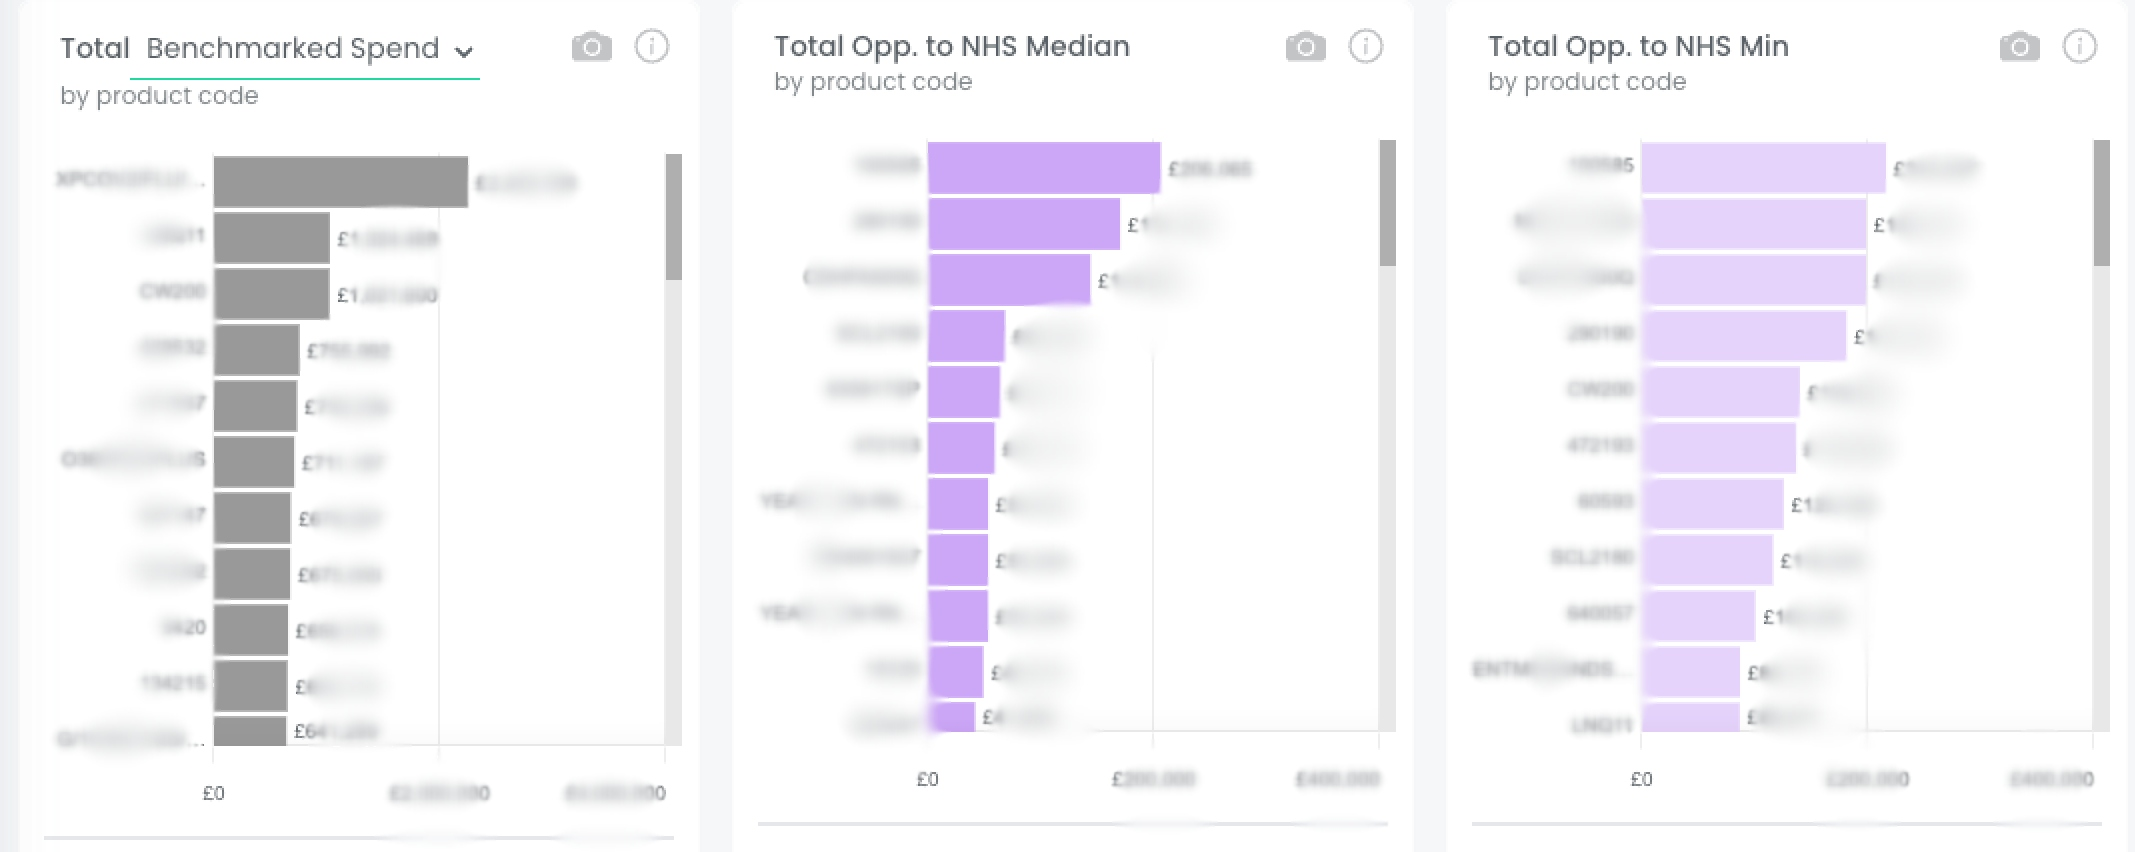
3. The graphs display core data related to variance:
a. 'Benchmarked Spend': total spend on a categorisation from the chosen metric.
b. 'Total Opp. to NHS Median': total spent on products at prices over the median across trusts.
c. 'Total Opp. to NHS Min': total spent on products at prices over the lowest price found in any trust.
Note
The calculated variance feeds the KPI output.
Variance is calculated by the difference in unit price between your most recent price paid and the median / minimum from the dataset in any given financial year.
This is then multiplied by the volume bought to date. The result depends on the date fields selected. Only positive variance is shown in the tool.
If you have any questions, please don’t hesitate to get in touch at support@adviseinc.co.uk or phone us on 0207 112 9222.
Was this article helpful?
That’s Great!
Thank you for your feedback
Sorry! We couldn't be helpful
Thank you for your feedback
Feedback sent
We appreciate your effort and will try to fix the article