AdviseInc Platform - v 1.1.2 (18/08/23)
Modified on Thu, 17 Aug, 2023 at 7:47 PM
TABLE OF CONTENTS
- New Features and Enhancements
- #1 - Hide your internal opportunities whilst benchmarking
- #2 - Your home is now your choice
- #3 - View the products that you could switch in the new Product Switch page
- #4 - Find out where the majority of your spend sits with the new Pareto analysis
- #5 - Check if your catalogue GTINs are genuine
- #6 - It’s now even easier to see how up-to-date your data is
- #7 - Your 6-page Healthcheck report is now even better
- #8 - Even more information texts have been added
- Bug Fixes
- Future releases
New Features and Enhancements
We continually evolve Platform with a roadmap of development that we’ll release over the next 12 months. We’ve highlighted some of the new features in this latest release below for you.
#1 - Hide your internal opportunities whilst benchmarking
What is it?
When looking at your opportunities you can now hide opportunities where you had previously achieved the minimum price, also known as your internal opportunities.
Why have we done this?
Teams had raised that some of the opportunities flagged to them were products where they had previously had the lowest price but had experienced a price increase. We wanted to help teams remove these from opportunities so you can just focus on those where other teams are achieving lower prices.
Where can I find this in Platform?
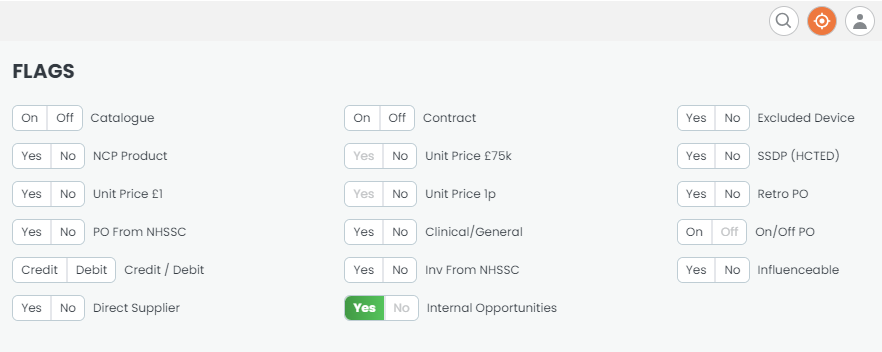
Click on the Quick filters (target icon) in the top right
Select ‘Yes’ next to ‘Internal Opportunities’
Review your opportunities within the PB section as normal, and remember to select a date range to look at the prices paid recently.
2 - Your home is now your choice
What is it?
Users can now choose where they land when they enter Platform. You no longer have to navigate out of the Home page.
Why have we done this?
We know that some people have their go-to pages. We wanted to limit your clicks as much as possible by giving you the option of opening straight onto the page you want.
Where can I find this in Platform?
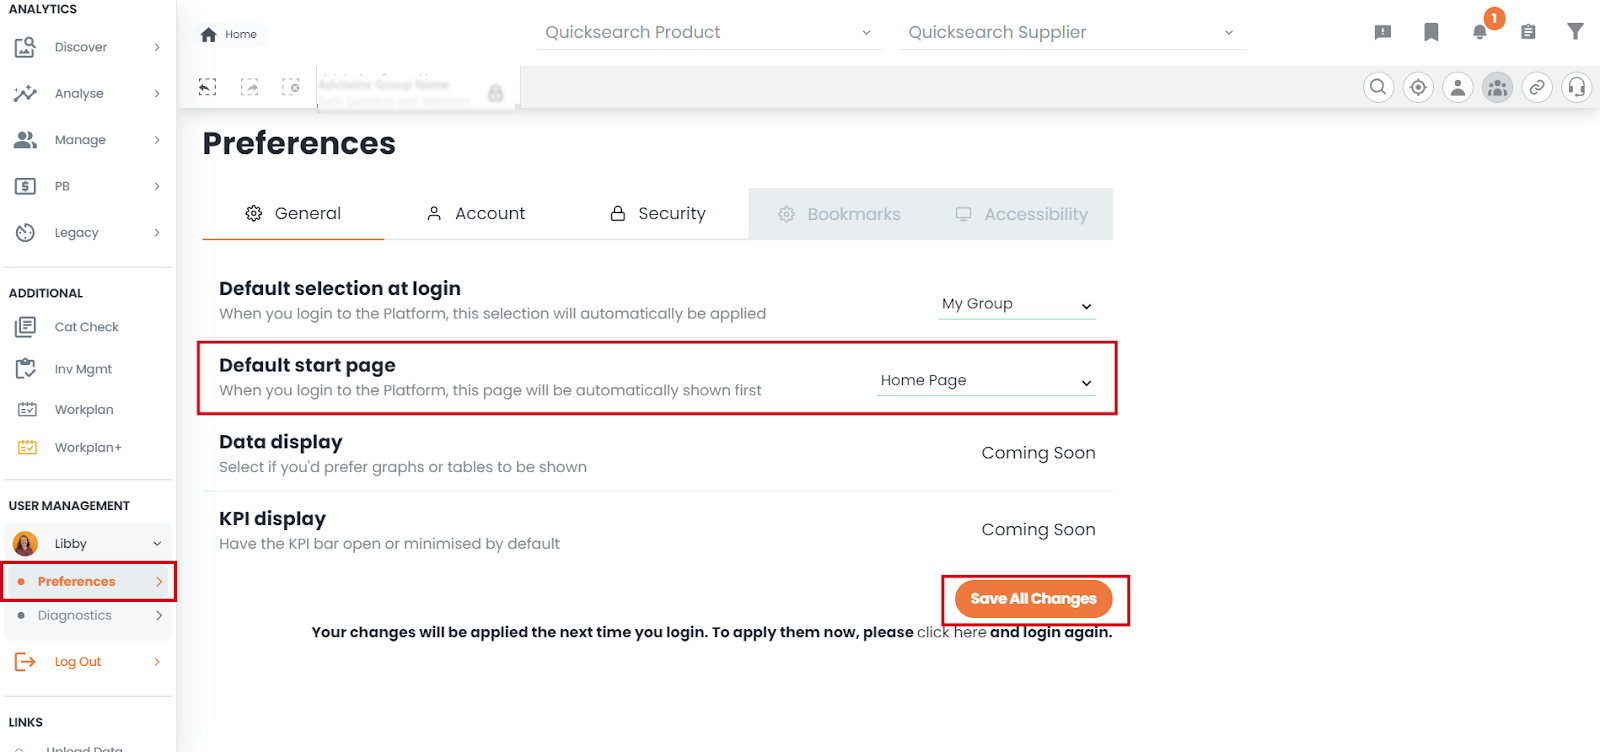
Left-hand navigation pane, head to the USER MANAGEMENT section
Click on your name (Libby in the example below) and go to Preferences.
Under General, you’ll see ‘Default start page’
On the drop-down, you can choose which page you would like to set as your home page as your default
Hit Save all changes to store.
#3 - View the products that you could switch in the new Product Switch page
What is it?
View possible product switches across a wide range of categories where we can see a possible cost saving by switching. View this at the summary and detail level.
Why have we done this?
We have been sharing product switch options with teams for years and we wanted to make it even easier for teams to get this information straight from Platform.
Where can I find this in Platform?
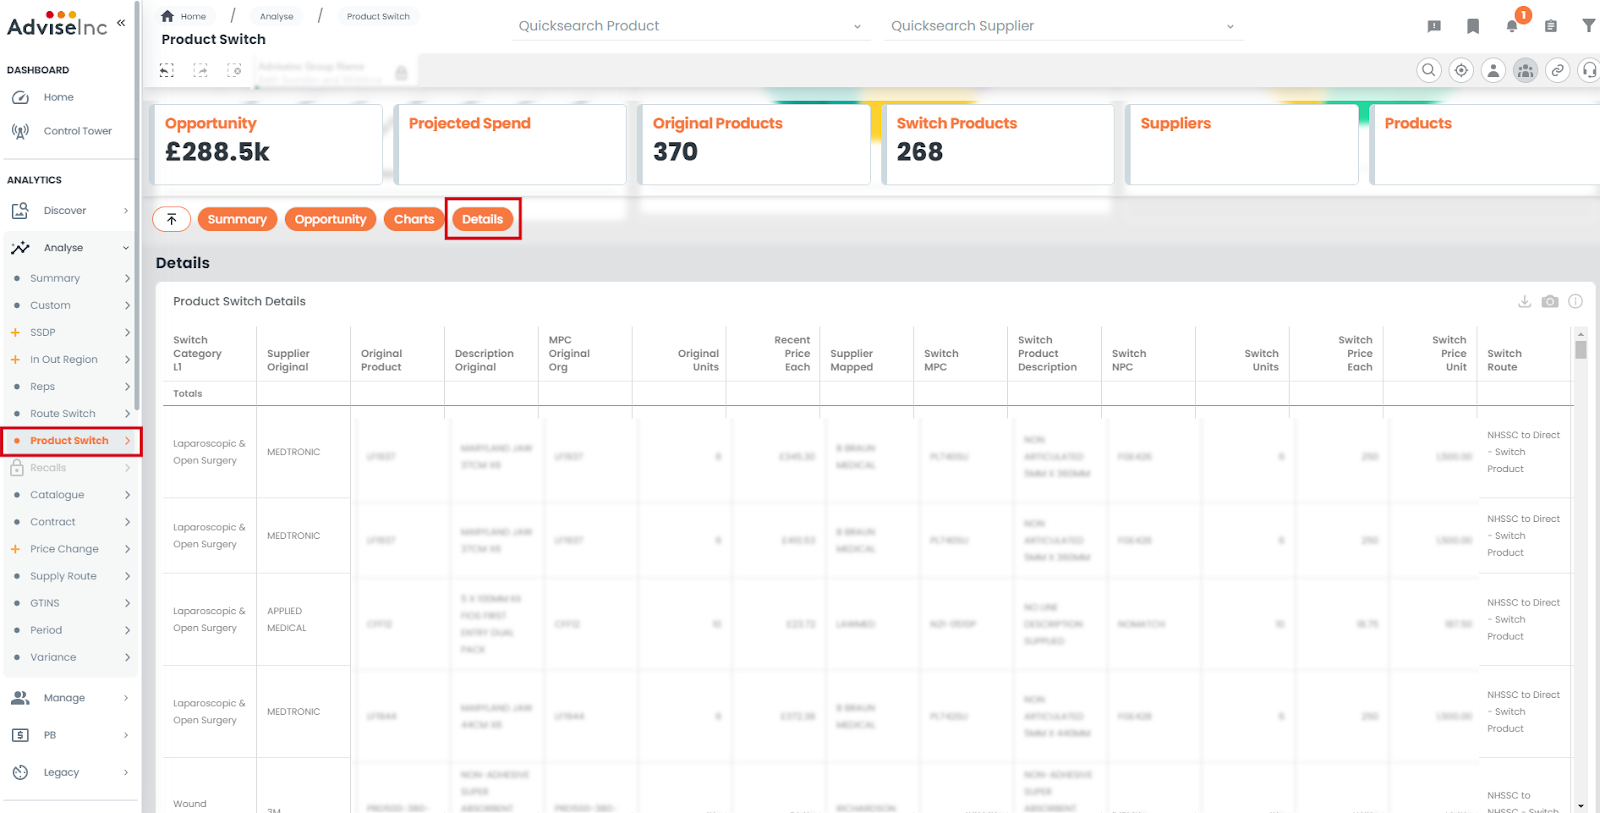
With your single organisation selected head to Analyse > Product Switch.
View summary information for categories at the top of page.
Navigate to the Details section to view specific product switches.
Export the table using the download icon in the top right of the tile.
NB: This page only works at a single organisation and will not be impacted by further filters eg cost centre
#4 - Find out where the majority of your spend sits with the new Pareto analysis
What is it?
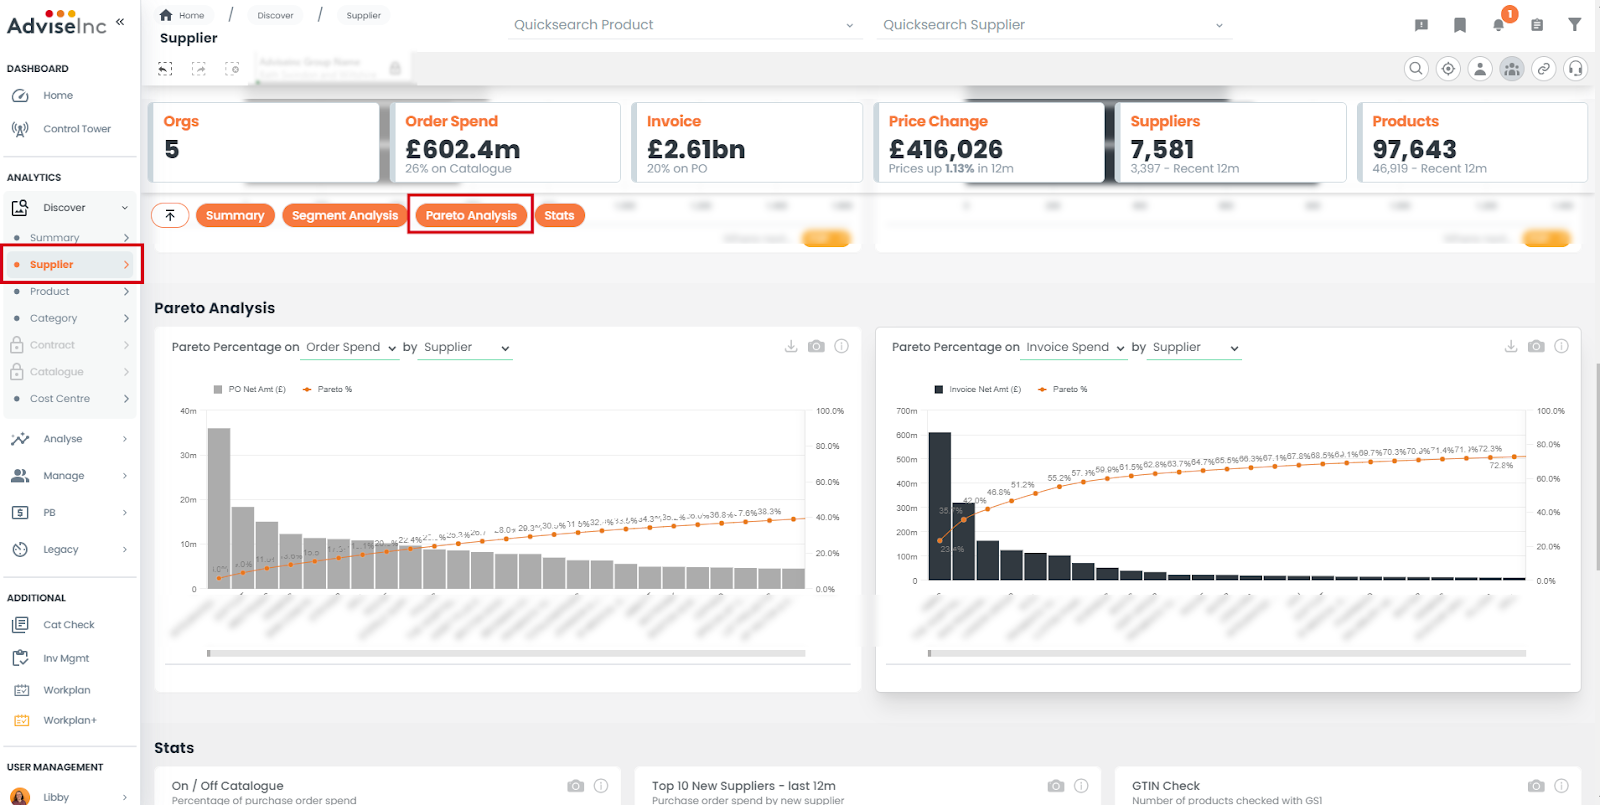
You can now view Pareto analysis for spend and the number of lines across PO and AP data for a number of dimensions including suppliers, cost centres, subjective codes and eClasses.
Why have we done this?
You asked and we delivered. Teams were keen to see where the majority of their spend was going and how that broke down
Where can I find this in Platform?
Head to the Discover > Supplier page and navigate to the Pareto analysis section
Select Spend or lines within the tile heading
Select the measure you wish to see the table by
Click the export button in the top right of the tile to download the backing data
#5 - Check if your catalogue GTINs are genuine
What is it?
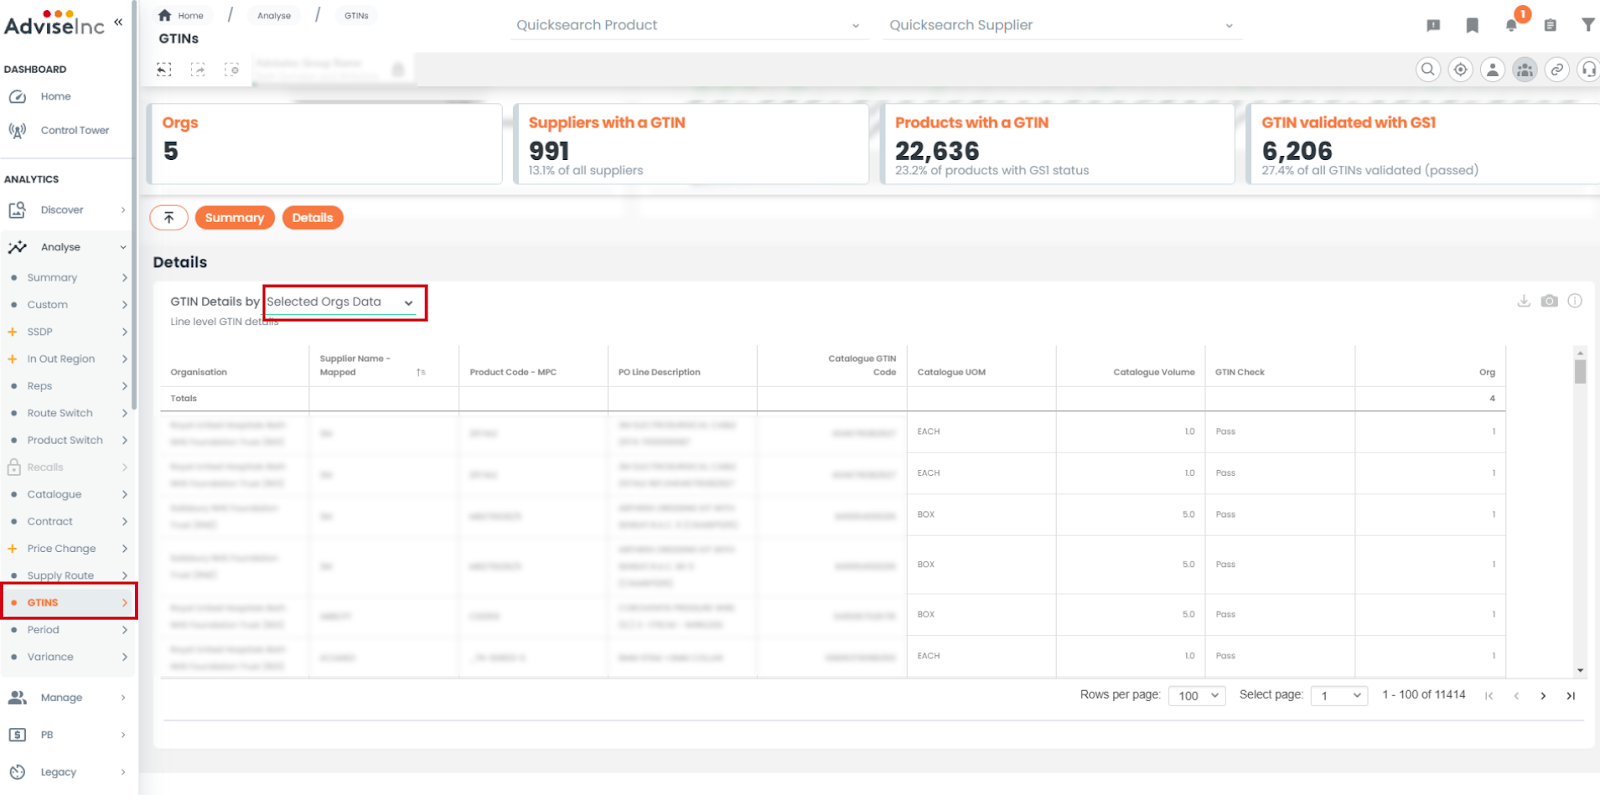
You can now see whether the GTINs from your organisation’s catalogue are GS1 genuine or not through our enhanced GTINs analysis.
Why have we done this?
To help you with improving your catalogue quality.
Where can I find this in Platform?
With your organisation selected head to the Analyse > GTINS page
Navigate down to the ‘Details’ section
Select ‘Selected Orgs Data’ from the drop-down in the title.
The column titled ‘GTIN Check’ shows whether the GTIN has passed or not through the GS1 checker.
You can export the information using the export icon in the top right of the tile.
#6 - It’s now even easier to see how up-to-date your data is
What is it?
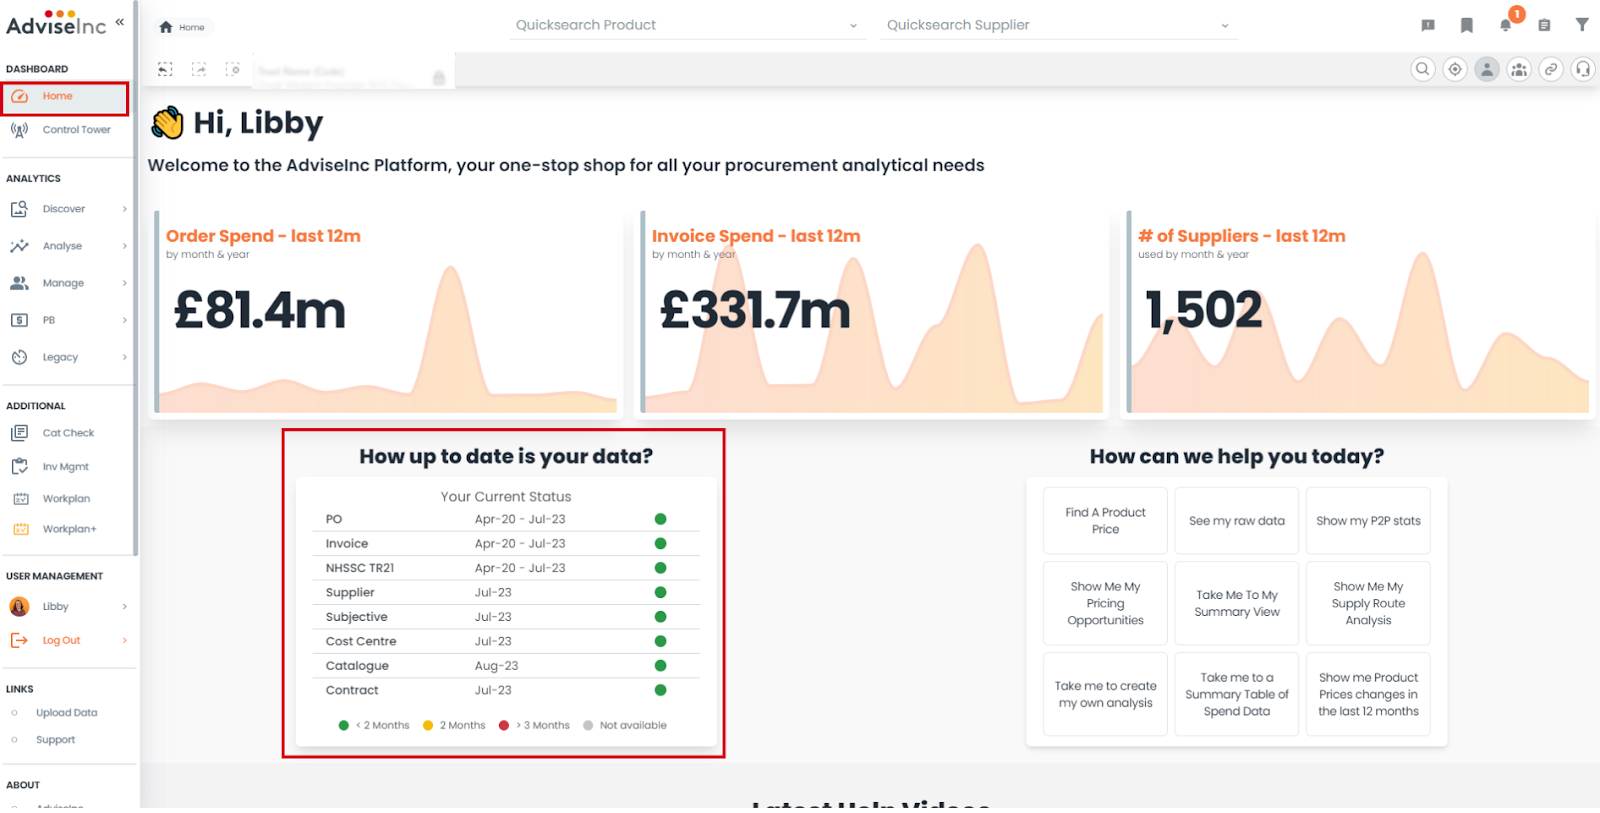
We’ve added a data status table for single organisations on the Home page so you can quickly see if you are missing any data
Why have we done this?
We wanted to save you some clicks and highlight where there may be an issue before you go too far into your analysis
Where can I find this in Platform?
With a single organisation selected, head to Home page and view the data stats table
If you need to view data status for more than one organisation head to Manage > Data Quality
#7 - Your 6-page Healthcheck report is now even better
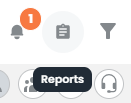
We’ve enhanced the Healthcheck report even more for you. Find it under the report icon in the top right of Platform. NB the healthcheck report can only be run with a single organisation selected.
#8 - Even more information texts have been added
We’ve been adding more and more information texts to the tables and charts throughout Platform, hover over the ‘i’ in the top right of tiles to view more information on these tiles.
Bug Fixes
A full list of enhancements and bug fixes is available in Platform under the ‘CHANGELOG’ section, accessed from the left-hand navigation bar.
Future releases
We’re always working on new features. Here’s a sneak peek of some of the ones we’re working on for a future release.
Share your bookmarks even easier with other users
Improvements in how you search for multiple products and suppliers
Was this article helpful?
That’s Great!
Thank you for your feedback
Sorry! We couldn't be helpful
Thank you for your feedback
Feedback sent
We appreciate your effort and will try to fix the article